
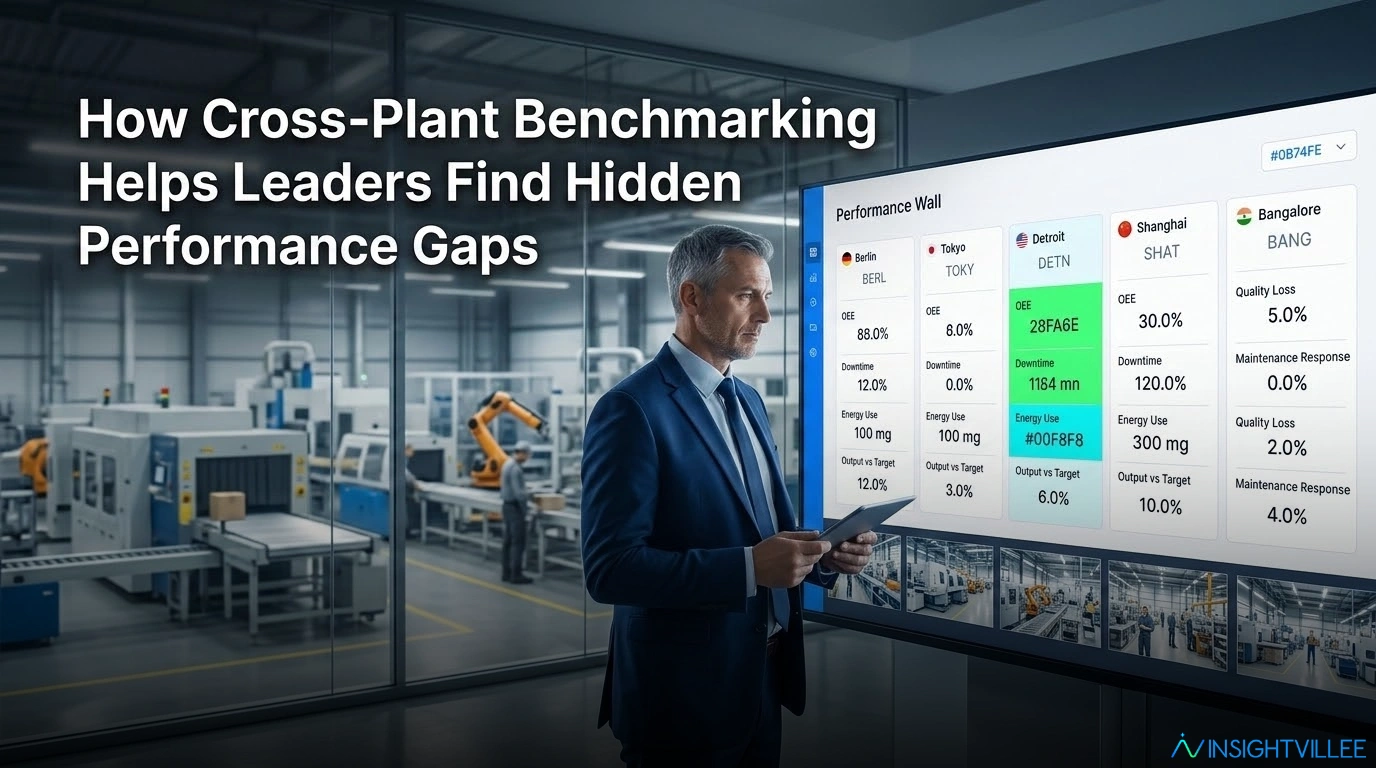
How Cross-Plant Benchmarking Helps Leaders Find Hidden Performance Gaps
Cross-plant benchmarking helps operations leaders see which plant is performing better, which plant is falling behind, and why the gap exists.
Many manufacturing groups receive reports from every plant. But the data is often delayed, inconsistent, or difficult to compare. One plant reports OEE by line. Another reports only total output. One plant shows downtime reasons clearly. Another sends a weekly summary.
The real problem is not lack of data. It is a lack of standardised visibility across plants.
What Is Cross-Plant Benchmarking?
Cross-plant benchmarking means comparing performance across multiple manufacturing plants using common KPIs, common definitions, and common reporting formats.
It helps leaders compare OEE, downtime, production output, energy consumption, quality, waste, maintenance, and safety performance across locations.
The goal is not to rank plants unfairly. The goal is to identify where performance differs and what can be improved.
ISO 22400 defines key performance indicators for manufacturing operations management, including KPI formulas, units, time behaviour, and user groups [ISO, 2014]. This matters because benchmarking only works when every plant measures performance in the same way.
In simple words, manufacturing benchmarking helps leaders compare plants fairly.
Why Do Operations Leaders Need Cross-Plant Benchmarking?
Operations leaders need cross-plant benchmarking because they cannot manage multiple plants through separate reports, different formats, and delayed summaries.
A leadership team may manage five, ten, or more plants. Each plant may have different machines, teams, products, and local practices. But leadership still needs one clear view of performance.
Cross-plant benchmarking helps answer practical questions. Which plant has the best OEE? Which plant has higher downtime? Which line consumes more energy? Which site has more quality loss?
Deloitte noted that manufacturers continue to face supply chain risks, delays, disruptions, and elevated costs [Deloitte, 2025]. In this environment, slow comparison between plants can delay corrective action.
This is why 6 multi-plant reporting problems that slow down operations leaders
When Do Performance Gaps Stay Hidden Without Cross-Plant Benchmarking?
Performance gaps stay hidden without cross-plant benchmarking when plants report data differently, send reports late, or keep downtime, energy, quality, waste, and safety data in separate systems.
A plant may look stable in its own report. But when compared with another similar plant, hidden gaps become visible.
For example, two plants may run similar packaging lines. Plant A may report better output. Plant B may show similar operating hours but lower finished goods. Without plant performance comparison, this gap may stay hidden for months.
Siemens reported that unplanned downtime costs the world’s 500 largest companies 11% of annual revenue, equal to about $1.4 trillion [Siemens, 2024]. For leaders, this makes hidden downtime gaps across plants too costly to ignore.
What Performance Gaps Can Cross-Plant Benchmarking Reveal?
Cross-plant benchmarking can reveal gaps in OEE, downtime, energy use, maintenance response, rework, waste, safety, planning, and output across similar plants or lines.
These gaps may not appear in individual plant reports.
A plant may have higher downtime on one machine type. Another may consume more energy per unit. One site may show higher rejection during the night shift. Another may have slower changeovers on the same SKU.
This answers what hidden performance gaps does cross-plant benchmarking reveal. It reveals the difference between what each plant reports and how each plant actually performs against the group standard.
Waste gaps can also stay hidden when plants report only totals. 6 waste reporting gaps that hide material loss in manufacturing plants
Why Do Standardised KPIs Matter in Cross-Plant Benchmarking?
Standardised KPIs matter in cross-plant benchmarking because leaders cannot compare plants fairly if every plant calculates OEE, downtime, energy, waste, or quality loss differently.
If one plant counts planned stoppage as downtime and another does not, the comparison becomes misleading.
If one plant reports energy at plant level and another reports energy by line, leaders cannot compare energy performance correctly.
This is why multi-plant KPIs need fixed definitions. Leaders must define OEE, downtime, energy per unit, waste percentage, quality loss, MTBF, MTTR, and maintenance response time in the same way across all plants.
This answers how to set standardized KPIs across multiple factories. Start with common definitions before building dashboards.
Key insight: a dashboard is not useful if every plant defines the same KPI differently.
How Does Cross-Plant Benchmarking Help Leaders Find Root Causes?
Cross-plant benchmarking helps leaders find root causes by showing where the gap exists first, then guiding teams to investigate why that gap exists.
Benchmarking does not stop at comparison. It starts the right investigation.
For example, two plants may run the same packaging line. One plant may produce lower output because of frequent micro-stoppages. Another may lose time due to slower changeovers. A third may have poor maintenance response.
The value is not only seeing which plant is behind. The value is understanding why similar plants perform differently in the same company.
When leaders compare plant data properly, they can identify whether the root cause is machine health, manpower, material flow, planning, quality, or maintenance.
how live floor data helps plants balance workloads across lines
What Metrics Should Leaders Compare in Cross-Plant Benchmarking?
Leaders should compare OEE, downtime, MTBF, MTTR, output, energy per unit, quality loss, waste percentage, maintenance response time, safety incidents, and carbon per unit.
These metrics show how plants perform across production, cost, reliability, quality, safety, and sustainability.
Important metrics include:
OEE by plant, line, machine, and shift.
Downtime hours and downtime reasons.
MTBF and MTTR.
Production output against plan.
Energy consumption per unit produced.
Specific Energy Consumption, or SEC.
Rejection, rework, and quality loss.
Waste percentage.
Maintenance response time.
Safety incidents and near misses.
Carbon emissions per unit produced.
ISO 50001 provides a practical way to improve energy use through an energy management system [ISO, 2025]. For plant leaders, this supports comparing energy performance across sites.
Energy gaps often explain why one plant performs better than another. why OEE improves but energy costs stay high in large plants
How Does AI-Driven Intelligence Improve Cross-Plant Benchmarking?
AI-driven intelligence improves cross-plant benchmarking by comparing large plant data faster and identifying patterns that manual review may miss.
The value is not the term. The value is faster decision-making.
It can show whether a performance gap is caused by machine health, energy use, production speed, maintenance delay, quality deviation, waste, or planning issues.
This supports cross-plant benchmarking for manufacturing operations leaders because they no longer need to wait for every plant to explain its own version of the issue.
Instead of asking, “Which plant is behind?” leaders can ask, “Why is this plant behind and what action should happen first?”
This is where smart factory operations what one intelligence layer changes for manufacturers becomes relevant for multi-location performance control.
What Should Better Cross-Plant Benchmarking Look Like?
Better cross-plant benchmarking should give leaders standardised KPIs, real-time visibility, plant-level and line-level comparison, alert-based prioritisation, and clear action tracking.
A better benchmarking system should include:
Standardised KPIs across all plants.
Real-time visibility instead of delayed reports.
Machine, line, shift, and plant-level comparison.
Cross-plant dashboards for leadership.
Alerts when one plant deviates from expected performance.
Benchmarking that connects production, energy, maintenance, quality, waste, and safety data.
Clear action tracking after a gap is found.
This is how to benchmark performance across multiple manufacturing plants. Do not compare only totals. Compare the operating reasons behind the totals.
The strongest benchmark is not the highest number. It is the clearest explanation of why one plant performs better than another.
Conclusion
Cross-plant benchmarking helps leaders find hidden performance gaps that individual plant reports often miss, especially when every plant reports differently or too late.
Operations leaders need one standard way to compare plants, identify underperformance, and understand root causes.
The goal is not more reporting. The goal is better decisions across every plant.
Cross-plant performance comparison for operations directors should show which plant needs attention, which plant is setting the standard, and which process should be improved first.
Insightvillee supports this shift as a transformation partner for large-scale manufacturers. Its multi-plant intelligence capability gives leaders a standardized view across facilities, with OEE monitoring, energy management, predictive maintenance, waste management control, and safety visibility connected in one real-time intelligence layer.
With go-live in 6 weeks and ROI within 6 to 9 months, Insightvillee helps leadership move from delayed plant reports to real-time performance control.
Key Takeaways
- Cross-plant benchmarking helps leaders compare performance across multiple plants using common KPIs.
- Hidden gaps appear when plants report data differently, late, or without machine and line-level detail.
- Standardised KPIs are the foundation of useful benchmarking.
- Leaders should compare OEE, downtime, energy, quality, waste, maintenance, safety, and carbon metrics.
- Better benchmarking helps leaders understand why one plant performs better than another.