
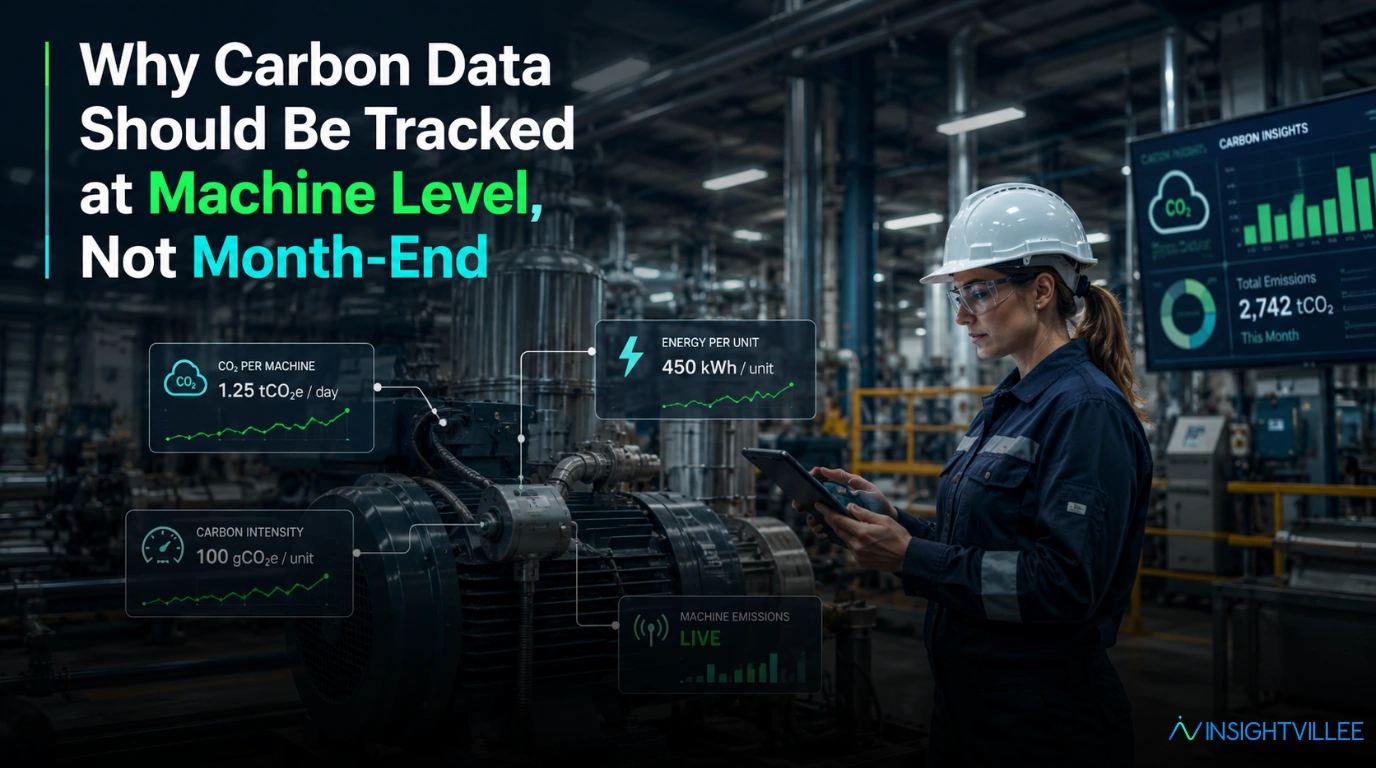
Why Carbon Data Should Be Tracked at Machine Level, Not Month-End
Carbon tracking manufacturing cannot depend only on month-end reports because emissions are created during live production, machine by machine, shift by shift.
Many plants still calculate carbon data after the month ends. Teams collect electricity bills, fuel records, production reports, water usage, waste records, and manual summaries. This may support reporting. But it does not show which machine, line, shift, batch, or process created the highest carbon load.
The industrial sector accounted for 37% of global energy use in 2022 [IEA, 2023]. For large manufacturers, carbon is not only an ESG number. It is connected to energy cost, machine performance, production efficiency, and plant control.
What Is Carbon Data in Manufacturing?
Carbon data in manufacturing is the information used to calculate emissions from plant operations, including electricity, fuel, steam, compressed air, water, waste, and production activity.
Carbon data shows how much emission is linked to plant operations. It includes direct fuel use, purchased electricity, process energy, utilities, material waste, water use, and production volumes.
GHG Protocol states that Scope 2 emissions cover purchased or acquired electricity, steam, heat, and cooling [GHG Protocol, 2015]. This matters because many manufacturing emissions are linked to the energy used by machines, utilities, and production lines.
In simple terms, carbon data is not separate from operations. A carbon footprint factory number is built from what happens every day on the floor.
Why Do Manufacturing Plants Track Carbon Data?
Manufacturing plants track carbon data for ESG reporting, customer requirements, regulatory expectations, investor pressure, and internal energy reduction goals.
Carbon reporting is becoming part of business reporting. IFRS S2 requires companies to disclose climate-related risks and opportunities that are useful for users of general-purpose financial reports [IFRS, 2023].
This affects ESG reporting manufacturing because large customers, investors, boards, and regulators want cleaner and more reliable emissions data.
Many plants also track carbon because energy and emissions are closely connected. If a machine consumes more power, the plant often carries both higher energy cost and higher carbon impact.
When leaders have accurate carbon data, they can identify where emission-heavy operations are also increasing operating cost.
why OEE improves but energy costs stay high in large plants
Why Is Month-End Carbon Tracking Not Enough?
Month-end carbon tracking is not enough because it gives a delayed summary. It shows the final number, but not the machine, shift, process, or reason behind the emission.
This is why month-end carbon reporting fails in factories. It is useful for documentation, but weak for daily control.
By the time the month-end report is prepared, the same inefficient machine may have run for weeks. The same compressed air leak may have continued. The same idle line may have consumed power without useful output.
ISO 14064-1 specifies principles and requirements for quantifying and reporting greenhouse gas emissions at organisation level [ISO, 2018]. But plant leaders also need operational detail to reduce emissions, not only report them.
Month-end reports answer how much carbon was generated. They do not always answer where it came from or what should change.
When Do Carbon Emissions Actually Happen in a Plant?
Carbon emissions happen during live operations when machines run, motors consume power, boilers generate steam, compressors operate, furnaces heat, chillers run, and materials are processed.
Emissions change by machine condition, load, idle time, shift, batch, and schedule.
For example, a compressor may run longer than needed because of air leakage. A chiller may run during low production. A furnace may consume more fuel during repeated start-stop cycles. A packaging line may idle while utilities continue running.
This is why carbon data should be captured close to the source, not calculated only later.
IIoT manufacturing how connected machines make hidden energy losses visible
Why Should Carbon Data Be Tracked at Machine Level?
Carbon data should be tracked at machine level because machine-level visibility shows which machines, lines, shifts, and processes are responsible for higher emissions.
Machine-level carbon tracking for manufacturing plants makes carbon reduction practical.
Instead of only seeing total monthly emissions, leaders can see carbon per unit produced, energy per batch, emissions by line, or machine-level emissions by shift.
This helps teams compare similar machines. One line may produce the same output with higher energy use. One machine may consume more power because of poor maintenance. One process may create higher carbon per batch because it takes longer than standard time.
What is machine-level carbon footprint tracking? It is the ability to link emissions to the machine or process where they are created.
What Problems Come From Tracking Carbon Only at Month-End?
Tracking carbon only at month-end creates delayed visibility, weak root cause analysis, unclear ownership, manual reporting pressure, and missed opportunities to reduce energy waste.
The plant may know the carbon number, but not the reason.
Common problems include:
Delayed visibility into high-emission areas.
No clear link between emissions and specific machines.
Difficult root cause analysis.
Weak accountability across shifts and lines.
Missed opportunities to reduce energy waste.
Manual consolidation for ESG reports.
Leaders know the total, but not the action.
Material waste can also increase emissions because wasted input has already consumed energy and resources. Plants should also review 6 waste reporting gaps that hide material loss in manufacturing plants
What Does Machine-Level Carbon Tracking Reveal?
Machine-level carbon tracking reveals which assets, shifts, lines, and processes are creating higher emissions than expected.
It can show machines consuming more energy than standard. It can show idle equipment adding unnecessary emissions. It can show which shift has higher carbon intensity.
It can also show lines producing the same output with different energy use.
For example, two filling lines may produce the same volume. But one may consume more power because of frequent stoppages, compressed air loss, or poor motor efficiency.
This is carbon reduction tracking at machine and process level. It shows where action should start.
What Key Carbon Metrics Should Plants Track?
Plants should track carbon per machine, carbon per line, carbon per unit produced, energy per machine, SEC, carbon intensity by shift, and peak demand impact.
The most useful metric is not only total emissions. It is emissions per useful output.
Specific Energy Consumption, or SEC, shows how much energy is used per unit of output. In simple terms, it helps leaders see whether the plant is producing efficiently or only consuming more.
Important metrics include:
- Carbon emissions per machine.
- Carbon emissions per line.
- Carbon emissions per unit produced.
- Energy consumption per machine.
- Specific Energy Consumption.
- Carbon intensity by shift or batch.
- Peak demand impact.
- Emissions linked to waste, water, and utilities.
These metrics help leaders connect carbon with cost, OEE, and production quality.
How Does AI-Driven Intelligence Improve Carbon Tracking?
AI-driven intelligence improves carbon tracking by finding abnormal energy and emission patterns faster than manual reports and linking them with machine, production, and maintenance conditions.
The value is not the term. The value is faster visibility.
If one machine suddenly consumes more energy per unit, the system should flag it. If one shift has higher emissions for the same output, the plant should know. If carbon rises after repeated downtime, leaders should connect those events.
This supports real-time carbon footprint tracking in manufacturing. It helps teams understand why emissions increased, not only that they increased.
Insightvillee supports carbon footprint tracking, energy management, OEE monitoring, and multi-plant intelligence. It connects machines, lines, and systems into one real-time intelligence layer so leaders can see where carbon and energy losses are building.
how cross-plant benchmarking helps leaders find hidden performance gaps
What Are the Best Practices for Moving From Month-End Carbon Reports to Machine-Level Tracking?
The best practice is to keep monthly carbon reports for compliance, but use machine-level data for daily control and carbon reduction.
Start with high-energy machines and processes. Do not try to track everything on day one.
Connect energy meters, production data, and machine data. Define carbon KPIs clearly. Track carbon per unit produced, not only total emissions.
Set alerts for abnormal energy and emission spikes. Review carbon data by machine, shift, line, and batch.
This is how to track carbon emissions at machine level in a factory. Start with where energy is highest, where production is critical, and where the plant already sees cost pressure.
For large groups, carbon visibility also needs plant-wise comparison. 6 multi-plant reporting problems that slow down operations leaders
Conclusion
Month-end carbon reporting is useful for documentation, but it is not enough for carbon reduction because emissions are created continuously at machine, line, and process level.
Manufacturing leaders need to know where carbon is created, when it rises, and what action can reduce it.
This is why machine-level tracking matters. It connects emissions to real operations. It shows which machine, shift, batch, or line needs attention.
The future of carbon management is not delayed reporting. It is live operational visibility.
Insightvillee supports this shift as a transformation partner for large-scale manufacturers. Its carbon footprint tracking capability supports machine and process-level visibility, and its locked outcomes include 15 to 18% carbon reduction in relevant deployments. These are deployment-specific outcomes, not universal guarantees.
For boards and regulators, the benefit is also clear. Audit-ready carbon data for manufacturing leaders becomes stronger when it is built from live plant activity, not only month-end summaries.
Key Takeaways
- Month-end carbon reports are useful for documentation, but weak for daily control.
- Machine-level carbon data shows where emissions actually come from.
- Carbon tracking is linked to energy cost, OEE, downtime, waste, and machine condition.
- Plants should track carbon per unit produced, not only total emissions.
- Real-time machine-level tracking gives leaders faster reduction opportunities.