
Why Better OEE Does Not Always Mean Lower Energy Cost
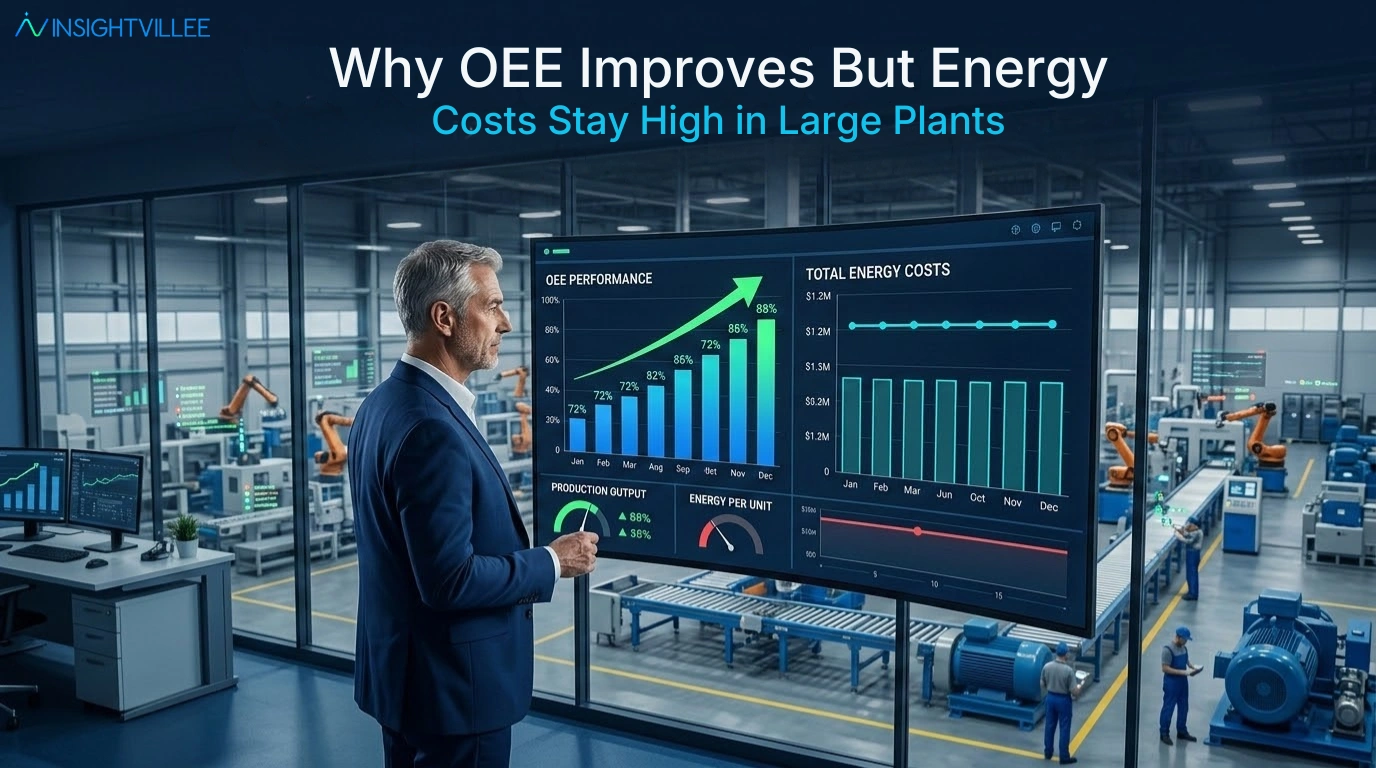
Better OEE does not always mean lower energy cost because machines and utilities can still consume power even when output improves.
In many large plants, production teams celebrate better OEE. Availability improves. Performance improves. Rejection reduces. But the monthly energy bill stays high. This happens because OEE and energy are often reviewed separately.
A line may produce more good units, but compressors, chillers, pumps, boilers, HVAC systems, and idle machines may still consume unnecessary energy. The plant improves production output, but does not control energy waste.
The industrial sector accounted for 37% of global energy use in 2022 [IEA, 2023]. For large manufacturers, energy is not a background cost. It is directly linked to plant performance.
The Connection Between Energy Efficiency and OEE in Large Plants
Key insight: OEE improvement shows better equipment effectiveness, but it does not automatically prove better energy efficiency.
What Does OEE Improvement Actually Show?
OEE improvement shows that equipment is producing more good output during planned production time.
OEE has three parts: availability, performance, and quality. Availability shows whether the machine was available to run. Performance shows whether it ran at the expected speed. Quality shows whether the output was good the first time [OEE.com, 2025].
For example, if breakdowns reduce, availability improves. If cycle time improves, performance improves. If rejection reduces, quality improves.
This is useful for Plant Heads because OEE shows where production time is being lost. But OEE does not always show how much energy was consumed to achieve that output.
A plant can improve OEE and still waste energy through idle running, oversized utilities, poor scheduling, and unnecessary peak demand.
Key insight: OEE measures productive use of time. Energy performance measures productive use of power. Both are needed.
Why Energy Cost Can Still Remain High
Energy cost can remain high because power consumption does not always fall or rise in direct proportion to output.
Many machines and utilities have a base load. This means they consume energy even when production slows, waits, or stops. A line may run better than last month, but if supporting utilities are not controlled, energy cost may not reduce.
For example, a paint shop may improve line output. But ovens, air handling systems, pumps, and compressors may continue running at high load during gaps. The result is better OEE but high energy per unit.
ISO 50001 focuses on improving energy performance through structured energy management [ISO, 2025]. This matters because energy cost needs active management. It does not reduce automatically just because production improves.
Key insight: energy cost remains high when plants improve output but do not control how power is consumed during production.
Common Reason 1: Machines Keep Running During Idle Time
Idle running increases energy cost because machines consume power without producing saleable output.
In many plants, machines remain powered during waiting time, material delay, changeover, inspection, or operator unavailability. The machine is not creating output, but electricity is still being consumed.
A common scenario involves a packaging line waiting for upstream material. The conveyors, sensors, drives, compressed air, and panels remain active. The production report may show improved OEE later in the shift, but the energy used during waiting time is already lost.
This is one of the most common hidden energy losses in large plants.
Key insight: idle time is not only a production loss. It is also an energy loss.
Common Reason 2: Utilities Consume Power Even When Lines Slow Down
Utilities keep adding cost because they often continue running even when production lines slow down.
Compressors, boilers, chillers, pumps, cooling towers, and HVAC systems support production. But many utility systems are not controlled according to actual line demand. They keep running at fixed load or inefficient partial load.
For example, a production line may slow down by 20%, but the compressed air system may continue operating at almost the same pressure and energy load. The line produces fewer units, but the utility cost does not reduce in the same ratio.
ENERGY STAR provides plant energy performance indicators to help manufacturers benchmark and improve energy performance [ENERGY STAR, 2025].
Key insight: utility energy waste often hides behind production improvement because utilities are reviewed separately from line performance.
Common Reason 3: Energy Is Not Tracked Per Unit Produced
Total power bills hide machine-level energy waste because they show how much energy was used, but not where or why it was used.
A plant may know its monthly electricity bill. It may also know total production output. But if energy is not tracked per line, machine, product, batch, or shift, the real source of waste remains unclear.
Energy per unit is more useful. It shows how much energy is consumed to produce one vehicle, tonne, batch, pack, or finished product.
For example, if total energy remains stable but output drops, energy per unit increases. That tells plant leaders that the plant is spending more energy for every good unit produced.
Key insight: total energy cost tells finance what was spent. Energy per unit tells operations where performance is leaking.
Common Reason 4: Rework and Quality Losses Add Hidden Energy Use
Rework increases energy cost because the plant consumes energy once to make the product and again to correct it.
Quality loss is often tracked as rejection, scrap, or rework. But the energy impact is not always visible. A rejected unit has already consumed machine time, labour, compressed air, electricity, heat, cooling, and inspection effort.
If the same product is reprocessed, more energy is consumed again. OEE may improve because final good output increases, but energy per good unit may still remain high.
In practice, quality loss is also an energy loss. Plants that ignore this connection underestimate the true cost of rework.
Key insight: every reworked unit carries hidden energy cost from both the first pass and the correction process.
Common Reason 5: Production and Energy Reports Are Separate
Why Teams Miss the Real Link Between Output and Energy Cost
Teams miss the link between output and energy cost because production reports and energy reports are usually reviewed separately.
Production teams review OEE, downtime, cycle time, and rejection. Utility teams review kWh, steam, compressed air, fuel, and peak demand. Finance reviews monthly cost. Each view is useful, but the connection is often missing.
A common example is a night shift where output is lower and energy use is higher. Production may blame material delay. Utilities may report higher consumption. Quality may report more rework. But unless these signals are connected, the root cause remains hidden.
7 Hidden Links Between Energy Waste and OEE Loss in Large Plants
Key insight: separate reports create separate explanations. Connected visibility shows the real operating cost.
What Large Plants Should Track Together
OEE, Energy Per Unit, Idle Time, Runtime, Rework, Downtime, and Utility Load
Large plants should track OEE and energy metrics together to understand the real cost of production performance.
Important metrics include OEE, energy per unit, idle time, machine runtime, downtime, cycle time, rejection, rework, utility load, peak demand, and line output.
Energy per unit is especially important because it connects energy consumption with actual output. It helps leaders see whether the plant is producing more efficiently or only producing more.
High-performing manufacturers usually compare energy per unit by line, shift, product, and operating condition. This shows whether energy cost is rising because of poor scheduling, slow cycles, idle running, or rework.
Key insight: the best energy metric is not total power consumed. It is power consumed per good unit produced.
How Real-Time Manufacturing Intelligence Helps
Connecting Energy Data With Machine and Production Performance
Real-time manufacturing intelligence helps by connecting energy data with machine status, production output, downtime, and quality performance.
Instead of showing energy as a monthly bill, it shows when energy was consumed, which machine consumed it, what output was produced, and whether the line was running efficiently.
Insightvillee fits into this category as a manufacturing intelligence platform. It helps plant teams connect machine, production, and energy data into one operational view. In relevant deployments, Insightvillee has recorded 15 to 20% energy savings and 15% OEE improvement. These are deployment-specific outcomes, not universal guarantees.
The value is not only monitoring. The value is helping teams act faster when energy waste and production loss appear together.
Practical Steps to Reduce Energy Cost Along With OEE Improvement
Simple Actions Plant Teams Can Start With
Plant teams can reduce energy cost along with OEE improvement by finding where energy is consumed without good output.
Start with these actions:
- Track energy per unit by line, shift, and product.
- Compare OEE improvement with energy per unit.
- Measure idle running time on critical machines.
- Check utility load during production gaps.
- Track energy used in rework where possible.
- Review peak demand events linked to poor scheduling.
- Compare runtime with actual good output.
Plant Heads should ask one direct question: where are we consuming energy without producing saleable output?
That question usually reveals the biggest improvement opportunities.
Conclusion
OEE improvement gives better results when energy is also controlled because plant performance is not only about producing more. It is about producing more with less waste.
A plant can improve OEE and still carry hidden energy losses. Machines may run idle. Utilities may remain loaded. Rework may consume energy twice. Reports may stay separate. These losses keep energy cost high even when production looks better.
[Link: Beyond Prediction: Closing the Execution Gap in Manufacturing Operations → /blog/prescriptive-intelligence-execution-gap]
The next level of manufacturing performance is connecting OEE tracking with energy monitoring. Insightvillee supports this direction by helping manufacturers turn production and energy visibility into practical plant-level decisions.