
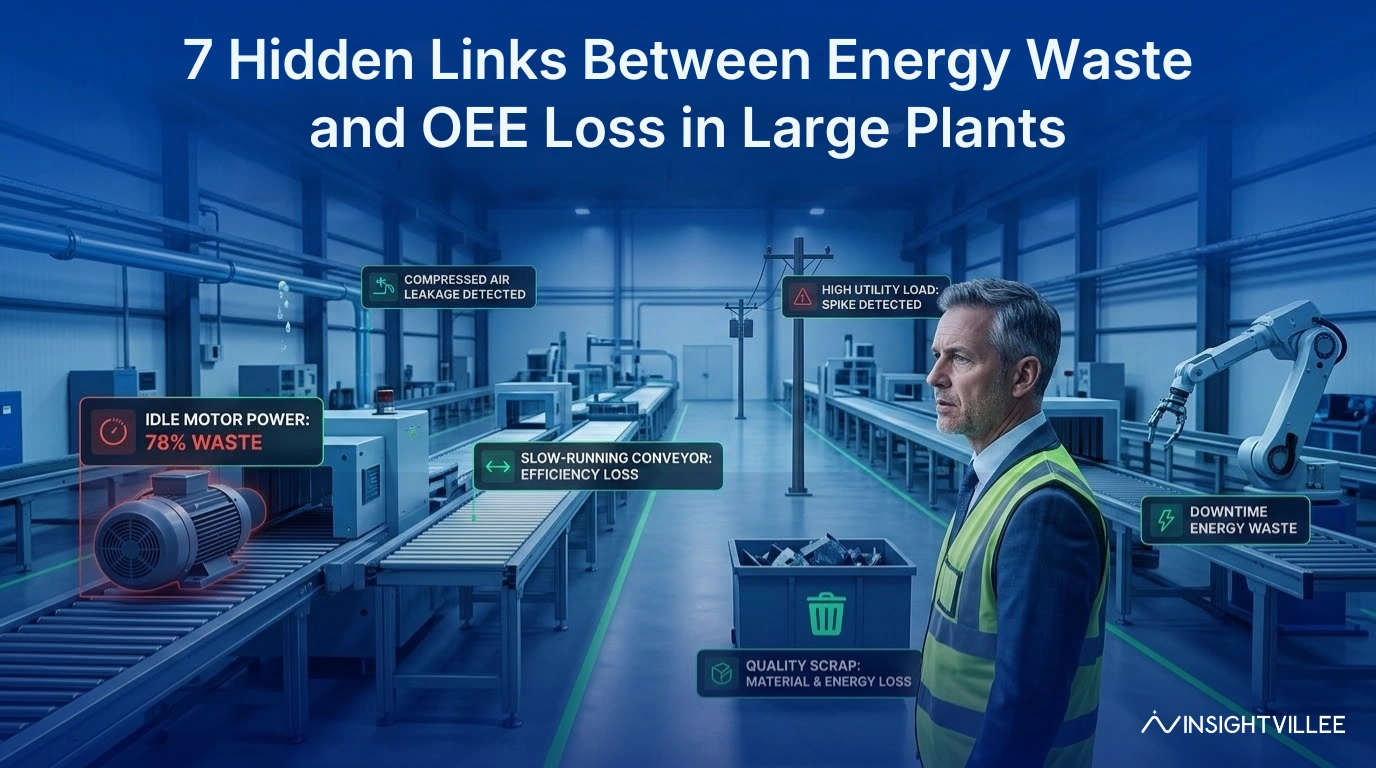
7 Hidden Links Between Energy Waste and OEE Loss in Large Plants
Why Energy Waste and OEE Loss Are Often Connected
Energy waste and OEE loss are often connected because the same shop floor problems that reduce output also increase energy consumed per good unit.
In many large plants, production teams review OEE while utility teams review energy consumption separately. This creates a blind spot. A line may lose time through idle running, slow cycles, breakdowns, or rework. At the same time, machines, compressors, pumps, chillers, and boilers continue consuming power.
The industrial sector accounted for 37% of global energy use in 2022 [IEA, 2023]. For large manufacturers, energy is not a side cost. It is directly linked to plant performance.
The Connection Between Energy Efficiency and OEE in Large Plants
Key insight: energy waste is often a production problem wearing the mask of a utility cost.
What Is OEE Loss?
Understanding Availability, Performance, and Quality Loss
OEE loss means the plant is not using planned production time to produce good output at the expected speed.
OEE has three parts: availability, performance, and quality. Availability loss happens when machines stop. Performance loss happens when machines run slower than expected. Quality loss happens when output is rejected or reworked [OEE.com, 2025].
For example, if a packaging line stops for 40 minutes, availability drops. If it runs slower than standard cycle time, performance drops. If finished units fail inspection, quality drops.
OEE helps Plant Heads see where production capacity is being lost. But OEE alone may not show how much energy was wasted during that lost time.
Key insight: OEE loss is not only lost time. It can also be wasted power, steam, air, fuel, and cooling.
What Is Energy Waste in Large Plants?
Energy waste means power, steam, fuel, compressed air, cooling, or heat is consumed without adding useful output.
In practical terms, energy waste happens when machines run idle, utilities stay loaded during production gaps, rejected products are reprocessed, or equipment runs inefficiently.
ISO 50001 provides a structured energy management approach to improve energy performance, including energy efficiency, energy use, and energy consumption [ISO, 2025].
For example, a line may wait for material for 20 minutes. The production output is zero during that period, but conveyors, panels, compressed air, lighting, and HVAC may continue running.
Key insight: energy waste is highest when plants consume energy without producing saleable output.
Link 1: Idle Machines Still Consume Energy
Idle machines reduce OEE and increase power cost because they consume energy while producing nothing.
Waiting time may happen because of material delay, operator unavailability, quality hold, tool adjustment, or line imbalance. The machine may not be producing, but drives, panels, motors, air systems, and supporting utilities may still remain active.
A common scenario involves a filling line waiting for packaging material. Production output stops. OEE falls. But the machine and utilities continue consuming energy.
Key insight: idle time is counted as production loss, but it should also be treated as energy loss.
Link 2: Slow Running Uses More Energy Per Unit
Slow running increases energy per unit because the machine takes more time and energy to produce the same output.
A line may continue running, but below standard speed. This may happen due to worn parts, poor material flow, frequent minor stoppages, or operator adjustments. Since the line runs longer to produce fewer good units, energy per unit increases.
For example, if a line is designed to produce 1,000 units per hour but produces only 800, many fixed energy loads continue. The plant pays more energy for each good unit.
Key insight: slow speed does not only reduce performance. It raises the energy cost of every product.
Link 3: Breakdowns Waste Both Time and Energy
Breakdowns waste both time and energy because machines and utilities do not always stop cleanly when production stops.
During a breakdown, operators wait, maintenance teams inspect, utilities may continue running, and restart often consumes extra energy. In process-heavy plants, heating, cooling, compressed air, or pumping may continue to maintain safe conditions.
For example, a breakdown in a paint line may stop output, but ovens, ventilation, pumps, and air handling systems may continue running. The plant loses production time and still consumes energy.
Key insight: breakdowns are not only downtime events. They are energy waste events too.
Link 4: Rework Consumes Energy Twice
Rework becomes an energy loss because the plant consumes energy once to produce the defective output and again to correct it.
Quality loss is usually measured through rejection, scrap, or rework. But the energy cost of that loss is often hidden. A rejected unit has already used electricity, compressed air, manpower, machine time, inspection effort, and utilities.
If it is reprocessed, the plant spends energy again. OEE captures quality loss, but energy reports may not show how much power was wasted because of rework.
Why OEE Improves But Energy Costs Stay High in Large Plants
Key insight: every reworked unit carries two costs, lost first-pass quality and repeated energy consumption.
Link 5: Poor Scheduling Increases Utility Load
Poor scheduling increases utility load when support systems run without matching actual production demand.
Large plants often run compressors, boilers, chillers, pumps, HVAC, and cooling systems for multiple lines. If production scheduling is uneven, these utilities may remain active even when output is low.
For example, a plant may run multiple utilities for a short production window because planning is not aligned with energy demand. The result is high peak demand, poor utility utilisation, and higher energy per unit.
ENERGY STAR states that plant energy performance indicators help manufacturers benchmark and optimise energy efficiency for operations [ENERGY STAR, 2025].
Key insight: utility energy waste often comes from poor coordination between production planning and energy demand.
Link 6: Bottlenecks Create Hidden Energy Waste
Bottlenecks create hidden energy waste because one slow process can make other machines wait while still consuming energy.
In many plants, one machine or station controls the pace of the full line. If that process slows down, upstream and downstream machines may wait, starve, or run intermittently. OEE drops because flow is disturbed. Energy waste increases because connected equipment is not producing useful output.
A common example is a slow packaging or curing stage. The line does not fully stop, but the full system runs below its best operating condition.
Key insight: one bottleneck can spread energy waste across machines that are not directly causing the delay.
Link 7: Separate Reports Hide the Real Problem
Separate reports hide the real problem because energy teams and production teams often investigate different symptoms.
Production reports show downtime, slow cycles, rework, and missed output. Energy reports show kWh, steam, fuel, compressed air, and peak demand. Both are useful, but they become more powerful when connected.
A common scenario involves high energy use during a shift with low output. Energy teams may see high consumption. Production teams may see slow throughput. Quality teams may see rework. Unless these are connected, the root cause remains unclear.
Key insight: separate reports create separate explanations. Connected visibility shows the true operating loss.
What Large Plants Should Track Together
Large plants should track OEE and energy metrics together to understand the real cost of production loss.
Important metrics include OEE, energy per unit, idle time, downtime, runtime, rework, rejection, cycle time, line output, utility load, and peak demand.
Energy per unit is especially useful. It shows how much energy is consumed to produce one good unit, tonne, batch, pack, or vehicle.
For example, if OEE improves but energy per unit also rises, the plant should check idle running, utility loading, rework, or scheduling gaps.
Key insight: the most useful energy metric is not total power consumed. It is energy consumed per good unit produced.
How Real-Time Manufacturing Intelligence Helps
Real-time manufacturing intelligence helps by connecting energy waste with machine performance, production output, downtime, and quality loss.
Instead of showing energy as a monthly bill, it shows when energy was consumed, which machine or line consumed it, what output was produced, and whether the line was running efficiently.
Insightvillee fits into this category as a manufacturing intelligence platform. It helps plant teams connect production, machine, and energy data into one operational view. In relevant deployments, Insightvillee has recorded 15 to 20% energy savings and 15% OEE improvement. These are deployment-specific outcomes, not universal guarantees.
The value is not more data. The value is helping teams see where energy and production losses are connected.
Practical Steps to Reduce Energy Waste and OEE Loss
Plant teams can reduce energy waste and OEE loss by identifying where energy is consumed without good output.
Start with these actions:
- Track energy per unit by line, shift, and product.
- Compare OEE loss with energy per unit changes.
- Measure idle running time on critical machines.
- Review utility load during production gaps.
- Track energy impact of rework where possible.
- Identify bottleneck stations and connected energy waste.
- Review peak demand events linked to poor scheduling.
Plant Heads should ask one direct question: where are we consuming energy without producing saleable output?
That answer usually reveals the most practical improvement opportunities.
Conclusion
Better Visibility Helps Plants Improve OEE and Control Energy Cost
Better visibility helps plants improve OEE and control energy cost because it shows where production losses and energy waste are connected.
Large plants cannot treat OEE and energy as separate subjects. Idle machines, slow running, breakdowns, rework, poor scheduling, bottlenecks, and separate reports can all reduce OEE while increasing energy cost.
The next level of manufacturing performance is connecting production visibility with energy visibility. Insightvillee supports this direction by helping manufacturers turn plant data into better operational decisions.