
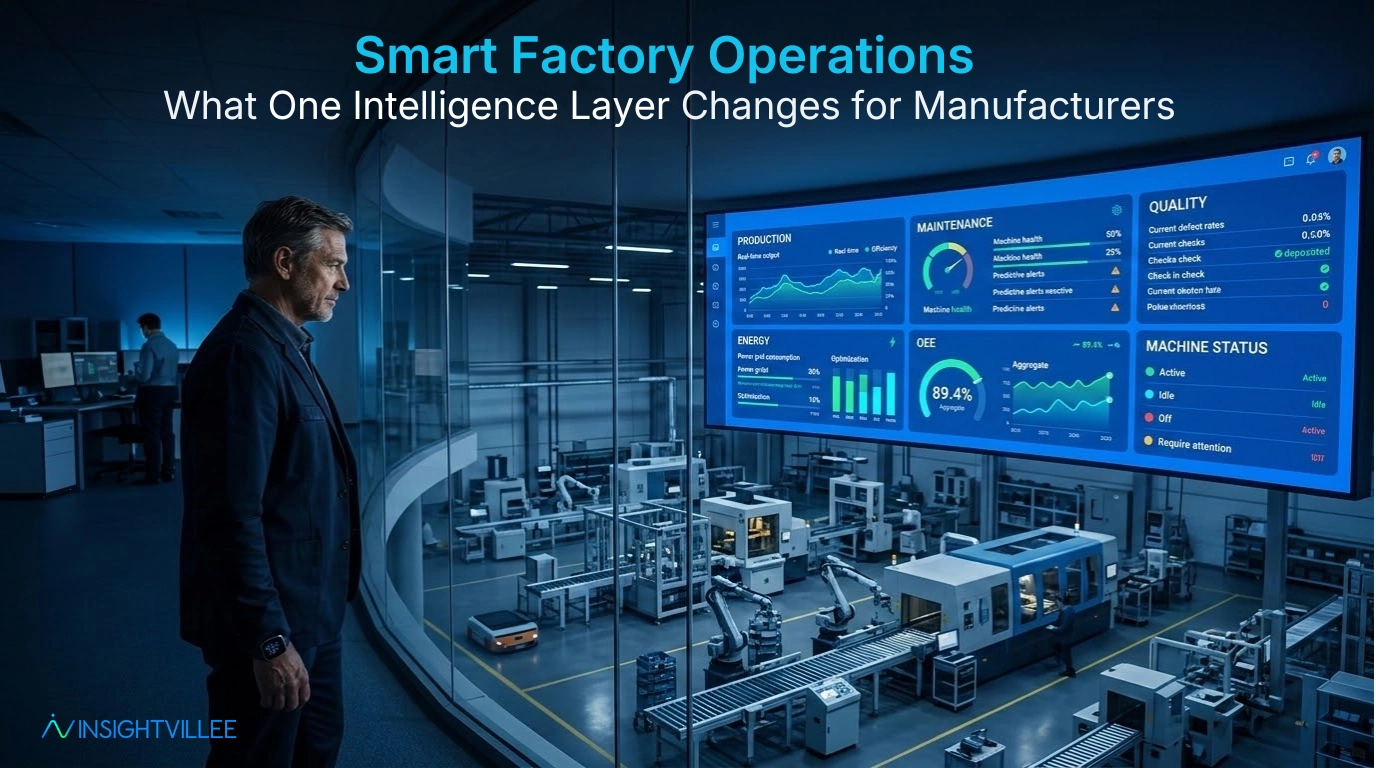
Smart Factory Operations: What One Intelligence Layer Changes for Manufacturers
Most large plants already have dashboards. Production systems. Maintenance logs. Energy meters. But each one shows a different slice of the same factory. None of them talk to each other. Smart factory operations require more than a collection of screens showing different numbers. They require one layer that connects all of it. Why End-of-Day Production Reports Are the Biggest Blind Spot explains exactly what plant leaders are missing when their data stays fragmented in separate reports.
This guide explains what an intelligence layer is, why it changes how plants operate, and what manufacturers gain when every system feeds one connected view.
What Is a Smart Factory Intelligence Layer?
Definition and Practical Meaning
A factory intelligence layer is a single platform that pulls data from every system in the plant and makes it available as one live, connected view. Machines, production lines, maintenance records, energy meters, quality checks — all in one place, in real time.
How It Differs From Traditional Dashboards
A dashboard shows you numbers. An intelligence layer shows you what those numbers mean together. It connects a drop in OEE to a machine running above temperature, links that machine to a missed maintenance task, and surfaces all three as one alert.
Why Manufacturers Need Intelligence, Not Just Data
Data without context produces confusion, not decisions. Factory intelligence turns isolated readings into connected insight that tells the right person what to do and when.
Why Manufacturing Data Becomes Fragmented
Machines, Lines, and Systems Operate in Silos
A PLC knows what a machine is doing. A SCADA system knows what the line is doing. An ERP knows what was planned. In most plants, none of these three talk to each other. Smart manufacturing requires connecting them, not just running them side by side.
Production, Maintenance, Quality, and Energy Teams Use Different Reports
Each department tracks its own numbers. Production chases OEE. Maintenance chases MTBF. Energy tracks consumption. But a quality issue that started with a maintenance gap and drove an energy spike will never appear in any one of those reports separately.
Plant Leaders Lack a Unified View of Operations
When a Plant Head has to open four systems to understand what is happening on the floor, the information is always late, always partial, and never complete enough to act on confidently.
What One Intelligence Layer Changes on the Plant Floor
Real-Time Visibility Across Machines and Lines
Every machine’s status, output, and health is visible in one screen, updated live. A slowdown on Line 4 appears the moment it starts, not when the shift report arrives.
Faster Detection of Operational Losses
Losses that hide inside shift averages, micro-stoppages, and lagging reports become visible as they happen. Smart factory operations at this level mean plant leaders can act within minutes, not after the damage is done.
Clearer Root Cause Analysis
When production, maintenance, energy, and quality data are connected, root cause analysis takes minutes instead of hours. The answer is already in the data. It just needed all the pieces in one place. explains how machine connectivity is what makes this kind of cross-system analysis possible.
How AI Turns Plant Data Into Operational Intelligence
Detecting Patterns Across Machine and Production Data
AI reads thousands of data points across shifts, lines, and machines and finds patterns that no human team could spot manually. A recurring drop in throughput every third shift on one line. A quality deviation that appears only above a certain ambient temperature.
Identifying Abnormal Performance Before It Escalates
Plant intelligence platforms do not wait for a failure before raising an alert. When a machine’s vibration pattern shifts, when current draw climbs above baseline, when cycle time drifts — the system flags it and assigns it a risk level.
Prioritizing What Needs Attention First
Not every alert is urgent. AI ranks exceptions by their likely impact on production so maintenance and operations teams always act on the most critical issue first, not the most recent one.
Key Areas Improved by a Unified Intelligence Layer
OEE and Production Performance
OEE tracked live by machine and line gives teams the ability to recover losses within the same shift. End-of-day OEE is history. Live OEE is a tool.
Predictive Maintenance and Asset Reliability
When machine health data feeds the same platform as production and energy data, maintenance decisions become predictive rather than reactive. From Reactive Callouts to Predicted Failures shows how this shift from reactive to predictive maintenance plays out in practice on the plant floor.
MES Integration and Quality Loss Tracking
MES integration connects production scheduling and quality data in real time, so rejection patterns are linked to the specific machine, shift, or operating condition that caused them.
Multi-Plant Performance Visibility
For organisations running more than one facility, a unified intelligence layer delivers standardised KPIs across all plants on one screen. Operational Directors can compare performance across sites without waiting for consolidated reports.
Real-World Scenario: When One Intelligence Layer Reveals the Real Problem
What Each Department Initially Saw
A paint manufacturing plant ran three separate systems: an ERP for production planning, a CMMS for maintenance, and a manual quality log. Each department tracked its own data. None of it connected.
Why the Problem Was Misread
Quality rejections on Line 2 had been rising for two weeks. The quality team blamed the raw material batch. The maintenance team had no visibility into Line 2’s machine health. ERP integration showed the production plan was being met, so leadership saw no red flag.
What Connected Data Revealed
After connecting all three systems into one intelligence layer, the platform identified that the rejections started four hours after a specific agitator motor began running 14 percent above its normal operating temperature. A worn seal was causing inconsistent mixing. The raw material was never the issue.
Corrective Actions Taken
The seal was replaced during the next planned window. Automated alerts were set for temperature deviation on all agitator motors. The quality log was replaced with real-time rejection tracking linked to machine conditions.
Business Impact After Unified Visibility
Rejections on Line 2 dropped by 76 percent in the following month. Two weeks of misdiagnosed quality loss, and the cost that came with it, were eliminated. The plant had the answer in its data the whole time. It just needed one layer to connect it.
Common Mistakes Manufacturers Should Avoid
Treating Smart Factory as Only a Dashboard Project
Dashboards display data. Intelligence platforms interpret it. The goal is not more screens. The goal is faster, better decisions.
Connecting Machines Without Defining Business Goals
Connectivity without a purpose produces noise. Before connecting anything, define what operational problem you are trying to solve.
Measuring Too Much Without Acting on Insights
More data does not automatically produce better decisions. Prioritise the metrics that connect directly to production performance, maintenance cost, and quality loss.
How Manufacturers Can Start Building One Intelligence Layer
Identify Critical Operational Problems First
Start with the problems that cost the most. Frequent unplanned downtime. High rejection rates. Rising energy bills with no clear cause. Let the problem define the starting point.
Connect High-Impact Machines and Lines First
A connected factory does not have to start with every machine. Begin with the assets and lines that have the highest impact when they underperform. SCADA integration and sensor connectivity on these priority assets alone will surface patterns the current systems cannot see.
Standardize Data Across Departments
Connected data is only useful when it is consistent. Align definitions for downtime, OEE, and rejection rate across production, maintenance, and quality teams before connecting systems.
Define Actionable KPIs
Every metric on the platform should connect to a decision. If a reading cannot tell a team what to do differently, it should not be on the primary view.