
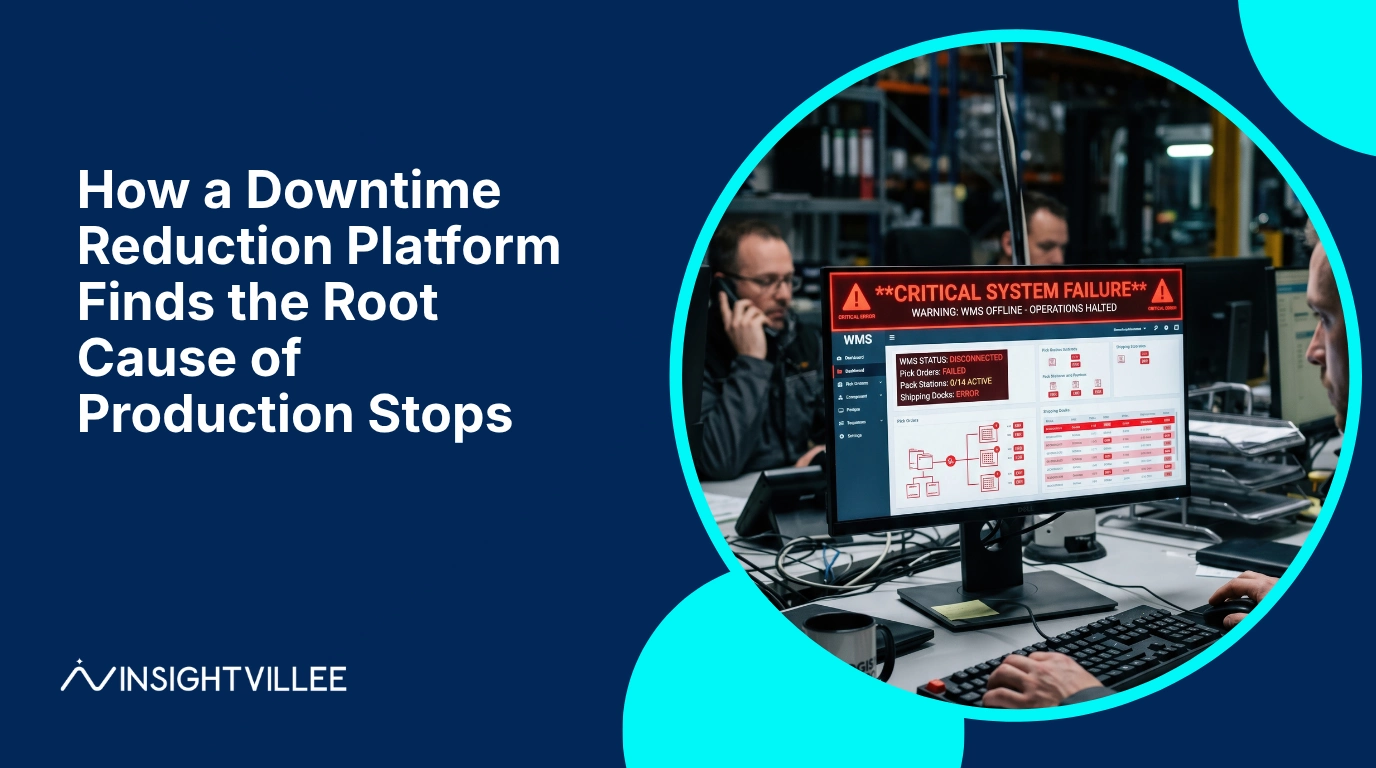
Downtime reduction platform root cause analysis connects production stops with machine, maintenance, process, and shift data to identify why downtime keeps recurring.
A downtime reduction platform does more than count stopped minutes.
It connects downtime events with machine health, work orders, maintenance history, production schedules, operator inputs, process conditions, and repeated failure patterns.
This matters because production downtime is often reported as a visible event, while the real cause sits deeper. A stoppage may be logged as a motor trip. The actual cause may be overload, poor lubrication, misalignment, process restriction, or repeated restart stress.
Why Does Downtime Reduction Matter for Large Manufacturing Plants?
Downtime reduction matters because repeated stops reduce output, damage OEE, increase maintenance cost, and weaken shift productivity.
In large plants, even short repeated stoppages can create serious production loss.
A five-minute stoppage may look minor on one line. But if it repeats across multiple shifts, affects a bottleneck asset, causes rework, or delays batch completion, the impact becomes much larger.
Siemens reported that unscheduled downtime costs the world’s 500 biggest companies 11% of annual revenues [Siemens, 2024]. That figure reinforces why downtime must be managed before it becomes a recurring operating pattern.
This is why plant leaders should connect downtime analysis with reliability measures such as MTBF and MTTR
Why Do the Same Production Stops Keep Happening?
The same production stops keep happening when teams restore production without removing the condition that caused the stop.
Many plants are strong at recovery. They are weaker at prevention.
A machine stops. The team resets it. A technician checks the visible fault. Production restarts. The shift moves on. But the real problem may still exist.
Common hidden causes include recurring bearing wear, unstable compressed air, poor lubrication, wrong operating settings, material flow variation, operator practice, sensor failure, utility fluctuation, or poor maintenance closure.
This is why root cause of repeated production downtime must be investigated with connected data, not memory alone.
How Does Downtime Monitoring Capture the First Layer of the Problem?
Downtime monitoring captures when a stop happened, where it happened, how long it lasted, and how often it repeated.
Downtime monitoring is the starting point.
It records machine stop time, line stop time, duration, frequency, shift, operator entry, reason code, and affected production area.
This gives plant leaders visibility into repeated production loss. But this first layer does not always explain root cause.
For example, a line may show repeated “machine jam” events. But the real issue could be feed variation, worn parts, wrong speed setting, or a upstream process instability.
Downtime monitoring shows the pattern. Root cause analysis explains why the pattern exists.
How Does a Downtime Reduction Platform Connect Machine and Production Data?
A downtime reduction platform connects stop events with machine condition, production context, and maintenance records to reveal what changed before the stop.
The platform looks beyond the downtime code.
It connects machine signals, production output, shift timing, maintenance actions, alarms, operator notes, and work orders. This makes repeated machine downtime analysis more reliable.
ISO 13374 provides guidance for processing, communicating, and presenting machine condition monitoring and diagnostic information [ISO, 2003]. For plant leaders, the practical lesson is simple. Machine condition data becomes valuable only when it supports a clear decision.
If a stoppage keeps happening after vibration drift, pressure instability, or rising current, the platform can help the team see that relationship. machine health signals
What Data Helps Identify Manufacturing Downtime Root Cause?
Manufacturing downtime root cause becomes clearer when stop data is connected with machine health, production load, maintenance history, and operating context.
Useful data includes downtime logs, machine alarms, vibration, temperature, pressure, current, flow, speed, load, runtime, shift data, work orders, inspection records, production output, batch or SKU data, operator notes, maintenance closure comments, and spare replacement history.
Each data point adds context.
A stop during high load may mean something different from the same stop during idle running. A repeated fault after repair may point to incomplete root cause correction. A recurring issue on one shift may indicate operating practice or manpower constraint.
The goal is not to collect everything. The goal is to connect the data that explains loss.
How Does Root Cause Analysis Separate Symptoms From Causes?
Root cause analysis separates symptoms from causes by checking whether the recorded stop reason explains the failure or only describes the event.
A symptom is what the team sees first.
A cause is what creates the symptom.
For example, “motor tripped” is a symptom. The root cause may be overload, overheating, misalignment, electrical imbalance, poor ventilation, or repeated start-stop stress.
“Pump low flow” is also a symptom. The root cause may be blockage, cavitation, suction issue, leakage, valve position, worn impeller, or process change.
A downtime reduction platform helps by comparing repeated stop events with machine and production patterns before, during, and after the event.
How Does Repeated Downtime Analysis Help Prioritize Action?
Repeated downtime analysis helps teams focus on the few recurring causes that create the biggest production loss.
Not every downtime event deserves the same attention.
A one-time minor stop may need monitoring. A repeated stop on a bottleneck asset needs action. A recurring utility issue affecting multiple lines may need a plant-level corrective plan.
ISO 22400 provides a KPI framework for manufacturing operations management, including indicators used to evaluate operational performance [ISO, 2014]. This matters because downtime decisions should connect with OEE, reliability, throughput, and production impact.
A good platform helps teams rank causes by frequency, total lost time, affected line, asset criticality, safety impact, and repair cost. This also helps teams prioritize machines needing attention when several issues compete for resources.
How Does Insightvillee Support Downtime Root Cause Visibility?
Insightvillee connects machine, line, and plant data into one intelligence layer so leaders can see recurring downtime causes clearly.
Insightvillee is an AI and Industry 4.0 platform that connects machines, plant systems, and operational data into one real-time intelligence layer.
For downtime reduction, this means production stops are not viewed as isolated events. They can be connected with machine condition, OEE monitoring, predictive maintenance, production planning, safety context, and maintenance workflows.
Insightvillee’s verified capabilities include OEE monitoring and improvement, predictive maintenance, multi-plant intelligence, safety and compliance automation, and smart production planning. In relevant deployments, locked outcomes include up to 40% reduction in unplanned downtime. This is deployment-specific, not a universal guarantee.
What Actions Should Teams Take After Downtime Root Cause Is Found?
Once the root cause is clear, teams should convert findings into corrective action, ownership, timelines, and follow-up measurement.
Root cause visibility has no value unless it changes what happens next.
Plant teams should define the corrective action, assign ownership, set closure dates, track whether the issue repeats, and measure impact on downtime, MTBF, MTTR, OEE, and production loss.
Actions may include asset repair, maintenance schedule changes, operator training, process adjustment, spare replacement, utility correction, sensor validation, or production planning changes.
Teams should also compare machine behavior before and after corrective action. machine health baseline
What Mistakes Do Plants Make in Downtime Root Cause Analysis?
The biggest mistake is treating downtime reason codes as root causes without validating them against real plant data.
Common mistakes include accepting operator reason codes without review, grouping many issues under “mechanical fault,” reviewing downtime only at month-end, ignoring minor repeated stops, not connecting downtime with maintenance records, and closing work orders without cause details.
Another mistake is counting completed repairs as solved problems.
A repaired machine is not proof that the root cause was removed. The proof is whether the stop stops repeating.
How Can Repeated Production Stops Be Prevented?
Repeated production stops can be prevented when teams connect downtime patterns with corrective action and measure whether the issue returns.
Prevention requires discipline.
Start with the top recurring downtime causes by lost time and frequency. Validate each cause with machine data, maintenance findings, production context, and operator input. Do not stop at the first visible symptom.
Then track whether the corrective action reduced recurrence. If the same stop returns, the original cause was incomplete or wrong.
This turns downtime management from firefighting into operating control.
How Does an Industry 4.0 Platform Improve Downtime Decisions?
An Industry 4.0 platform improves downtime decisions by connecting plant data that is usually scattered across machines, systems, teams, and shifts.
As an Industry 4.0 platform, Insightvillee AI connects ERP, MES, SCADA, PLC, sensor, and machine data so plant teams can act on live operational information.
This matters because downtime root cause is rarely stored in one place. It may sit partly in machine signals, partly in operator notes, partly in production schedules, and partly in maintenance records.
When these are connected, plant leaders can see patterns earlier and respond with better corrective action.
Turning Root Cause Visibility Into Downtime Reduction
Downtime reduction happens when root cause visibility leads to repeatable corrective action on the plant floor.
The future of downtime management is not more reports. It is faster understanding of why the same losses keep returning.
A downtime reduction platform should show where production stopped, why it stopped, what pattern preceded the stop, what action was taken, and whether the stop returned.
Insightvillee AI functions as an Industry 4.0 platform by connecting live machine and production information with the operational context needed for faster plant decisions.
That is how manufacturers move from symptom-based downtime management to evidence-based operating control.
Key Takeaways
Repeated production stops usually mean the plant is fixing symptoms, not root causes.
Downtime monitoring shows when and where stops happen, but root cause analysis explains why they keep returning.
A downtime reduction platform connects machine, production, maintenance, and shift data to reveal recurring causes.
Reason codes should be validated with real plant data before being treated as root causes.
The value comes when root cause visibility turns into corrective action and reduced recurrence.